The power grid is overloaded in several regions in the Netherlands. Grid operators plan to tackle this problem region by region, starting in the areas where the grid congestion greatest.
What is the capacity map?
The capacity map shows at a glance the availability of transmission capacity for electricity off-take in different areas. This is for planning new projects, such as building homes, business premises or industrial facilities that depend on a reliable power supply.
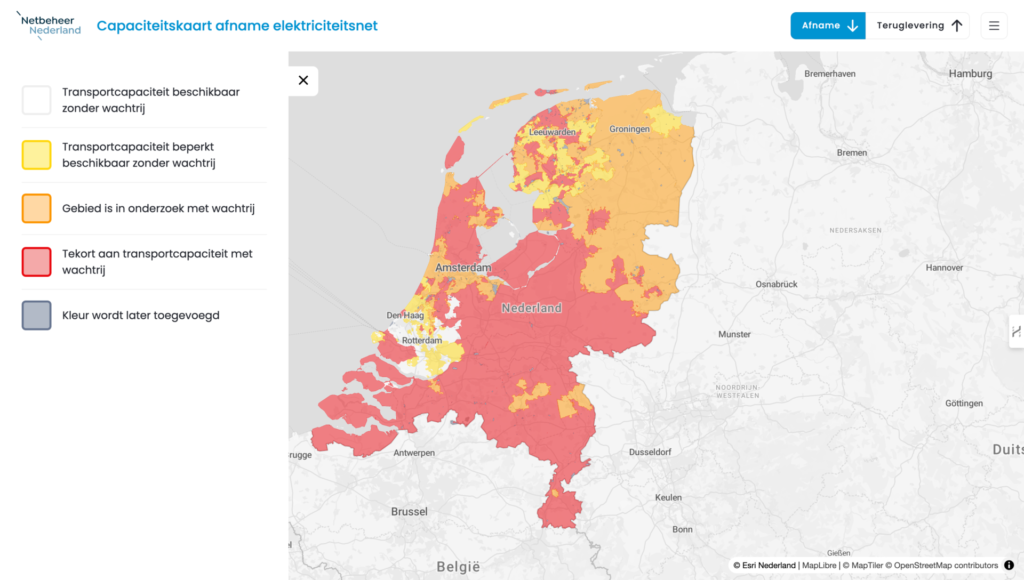
This image shows the capacity map of the electricity grid in the Netherlands, specifically for the off-take of electricity. The map is managed by Netbeheer Nederland and provides insight into the availability of transmission capacity in different regions of the country.
Source: Netbeheer Nederland
Explanation of the colours on the map
The map uses different colours to indicate the status of transport capacity in different regions. The legend on the left side of the map clarifies the colour coding:
- White: Transport capacity available without queuing. Sufficient capacity is available in these areas to meet demand immediately.
- Yellow: Transport capacity available limited without queuing. Some capacity is available here, but it is limited and can fill up quickly.
- Orange: Area is under investigation with queue. These regions are currently being investigated to increase capacity, but there is a queue for new connections.
- Red: Shortage of transmission capacity with queue. These areas face a shortage of capacity and there is a queue for new connections. This means new projects may be delayed.
- Grey: Colour will be added later. These are areas for which the capacity status has not yet been determined and will be updated later.
Regions in the Netherlands
On the map, several regions in the Netherlands are coloured according to this legend. Large parts of the country, including the Randstad (Amsterdam, The Hague, Rotterdam), are coloured red, indicating shortage of transport capacity with queuing. Other areas, such as parts of Friesland and Groningen, are coloured yellow or orange, indicating limited availability or areas under investigation.
This map is a useful tool for businesses and households to understand the current status of the electricity network and plan for any expansions or adjustments to their energy consumption.
How WattMaestro can help
At WattMaestro, we understand the challenges associated with the limited transmission capacity of the power grid. Our experts can help you navigate this complexity. We offer support for:
- Grant applications: We will help you identify suitable grants and guide you through the application process.
- Optimisation of energy consumption: Our advanced solutions help you optimise your energy consumption to reduce pressure on the grid.
- Project planning and implementation: We offer comprehensive guidance in the planning and implementation of your energy projects so that you can take maximum advantage of available capacity.
Want to know more about how WattMaestro can support you with your energy projects? Get in touch today contact with us and discover the possibilities!